前言
在Airsim若要使用Lidar传感器并进行显示,一般都离不开rviz,使用rviz对ros的topic进行显示,但也因此,需要先将数据封装成ros的消息类型,我没有采用官方的airsim_ros包,而是自己进行封装创建。
那么目前导航功能包集只接受使用sensor_msgs/LaserScan或sensor_msgs/PointCloud及新出来的sensor_msgs/PointCloud2消息类型发布的传感器数据。
但我在google或者百度上也搜寻了很多LaserScan和PointCloud之间的区别,没怎么找到,更多的都是介绍如何使用这两个类型去发布ros数据。因此,也只有根据自己的理解去记录。
一、Airsim添加Lidar传感器
详情请点击官方Lidar文档
| Parameter | Description |
|---|---|
| NumberOfChannels | 激光雷达线束(单线或多线),默认为16线 |
| Range | 扫描范围(单位米) |
| PointsPerSecond | 每秒捕获的点数 |
| RotationsPerSecon | 每秒轮换数 |
| HorizontalFOVStart | 水平起始角度(以度为单位) |
| HorizontalFOVEnd | 水平结束角度(以度为单位) |
| VerticalFOVUpper | Vertical FOV upper limit for the lidar, in degrees |
| VerticalFOVLower | 垂直角度下限(以度为单位) |
| X Y Z | 激光雷达相对于车辆的位置(NED坐标,米为单位) |
| Roll Pitch Yaw | 激光雷达相对车车辆的方向(以度为单位) |
| DataFrame | 输出中的点的框架 |
在浅谈激光雷达一文中解释了相关线束的含义,通过浏览,个人理解为:每个线束每秒捕获的点数都有个最大值,如100000,那么多线则能捕获更多的点数,因此多线可以捕获到上百万的点数。单线可以表示为单个圆,多线可以有多个圆。
且多线激光中一般垂直方向角度的范围为40度(不超过40度),忘记是在哪篇文章上看到过
1.1 settings.json默认配置
1 | { |
如果调用getLidarData()函数,则将返回点云数组、时间戳和雷达位姿,其中:
点云在雷达坐标系中(NED坐标系,以米为单位)
雷达位姿在车的坐标系中(NED坐标系,以米为单位)
1.2 简单json配置,测试
1 | { |
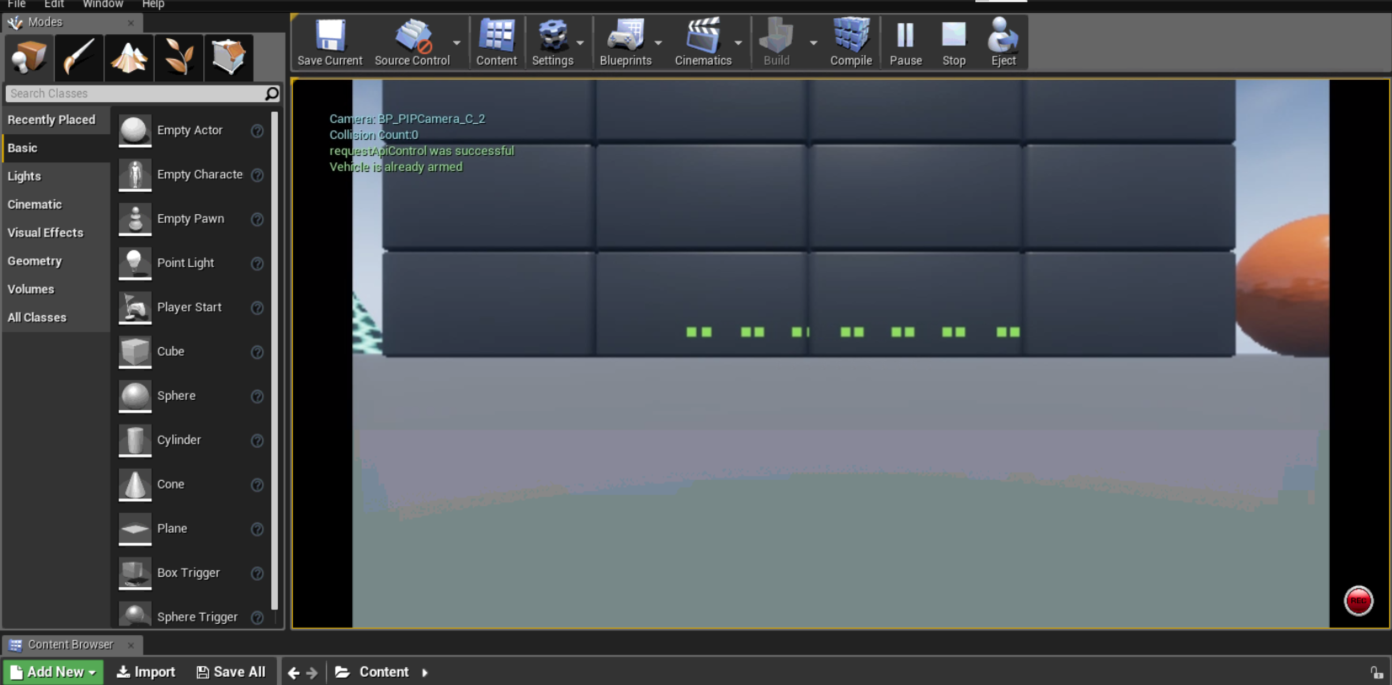
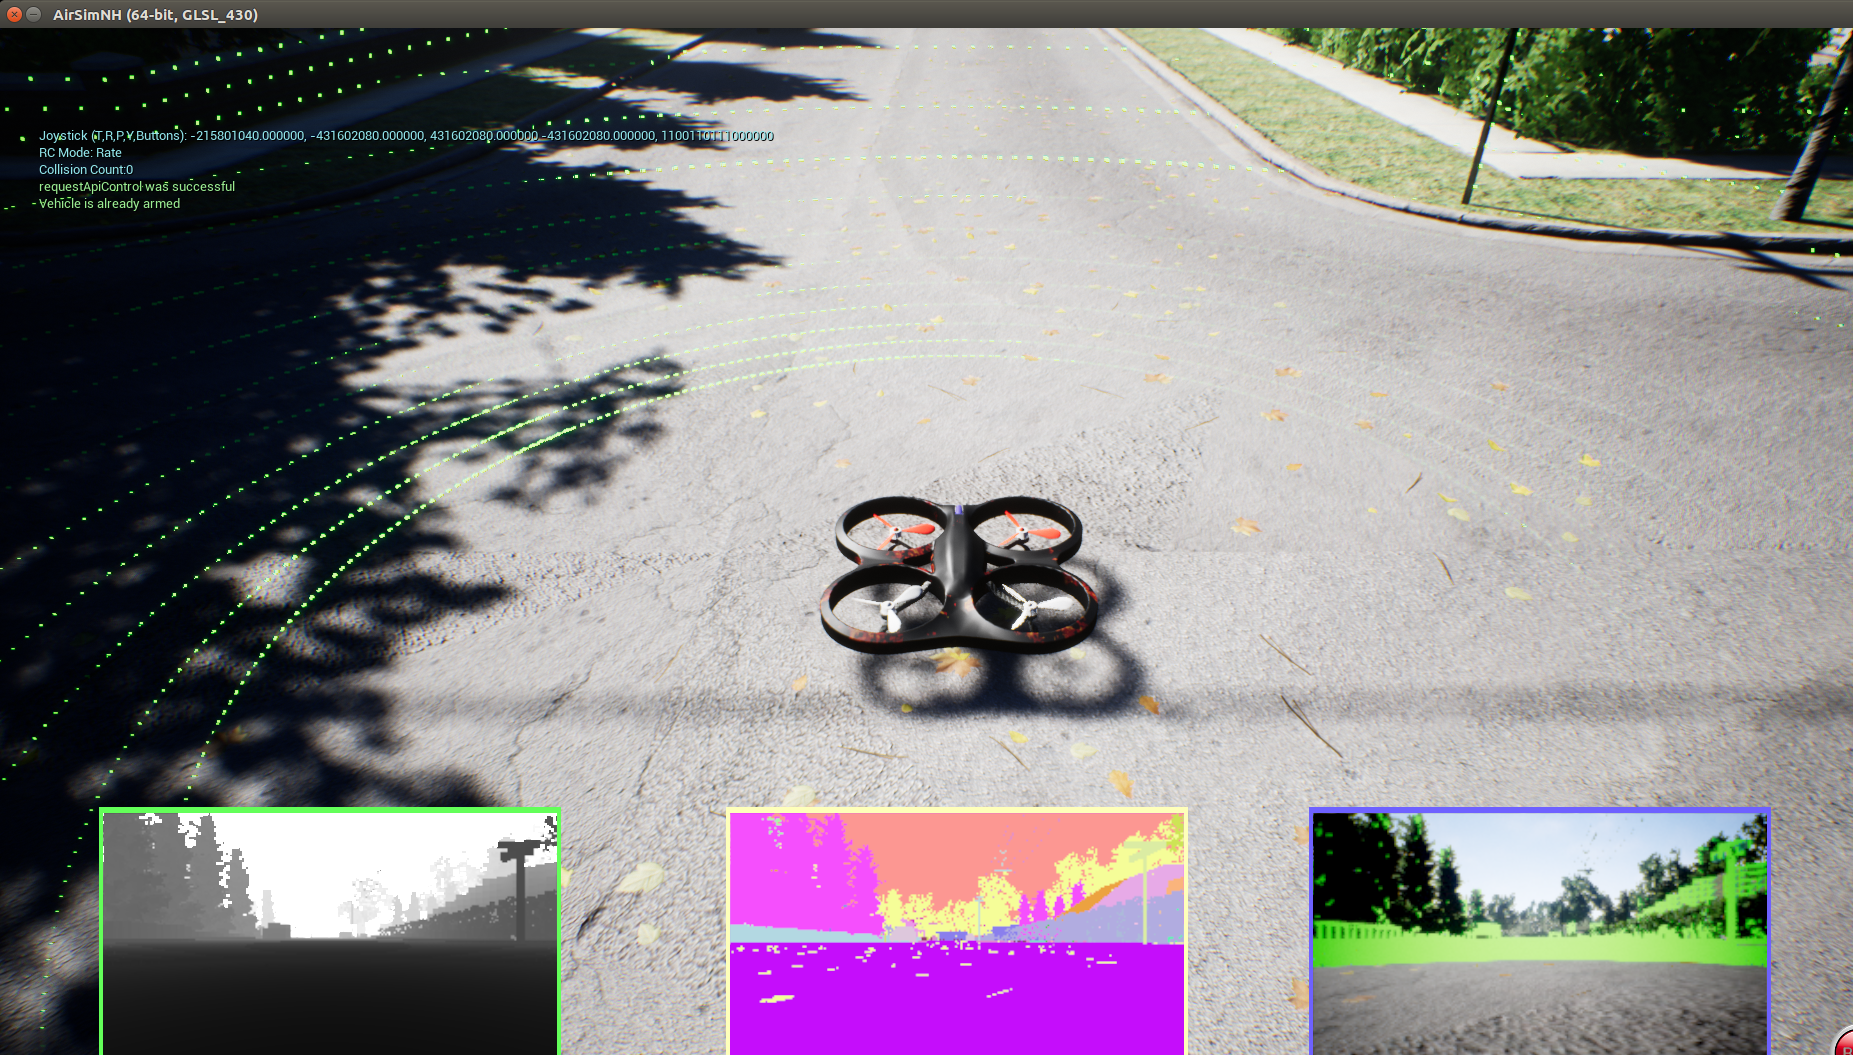
环境中的显示(第一视角)
Python代码编写,获取雷达数据
1 | #!/usr/bin/env python |
这里不展示输出内容,因为输出内容比较多,占位置,在每次运行时,其获得的雷达点的个数可能会稍有不同,并且雷达探测到的点也会不一样,不相同才是正常的。
二、单线激光雷达设置
2.1 settings.json设置
为什么要将垂直角度设置为0?因为个人理解单线是水平的,即2维的,如果设置了垂直角度,则将变成三维,后面会显示设置了垂直角度后的区别
1 | { |
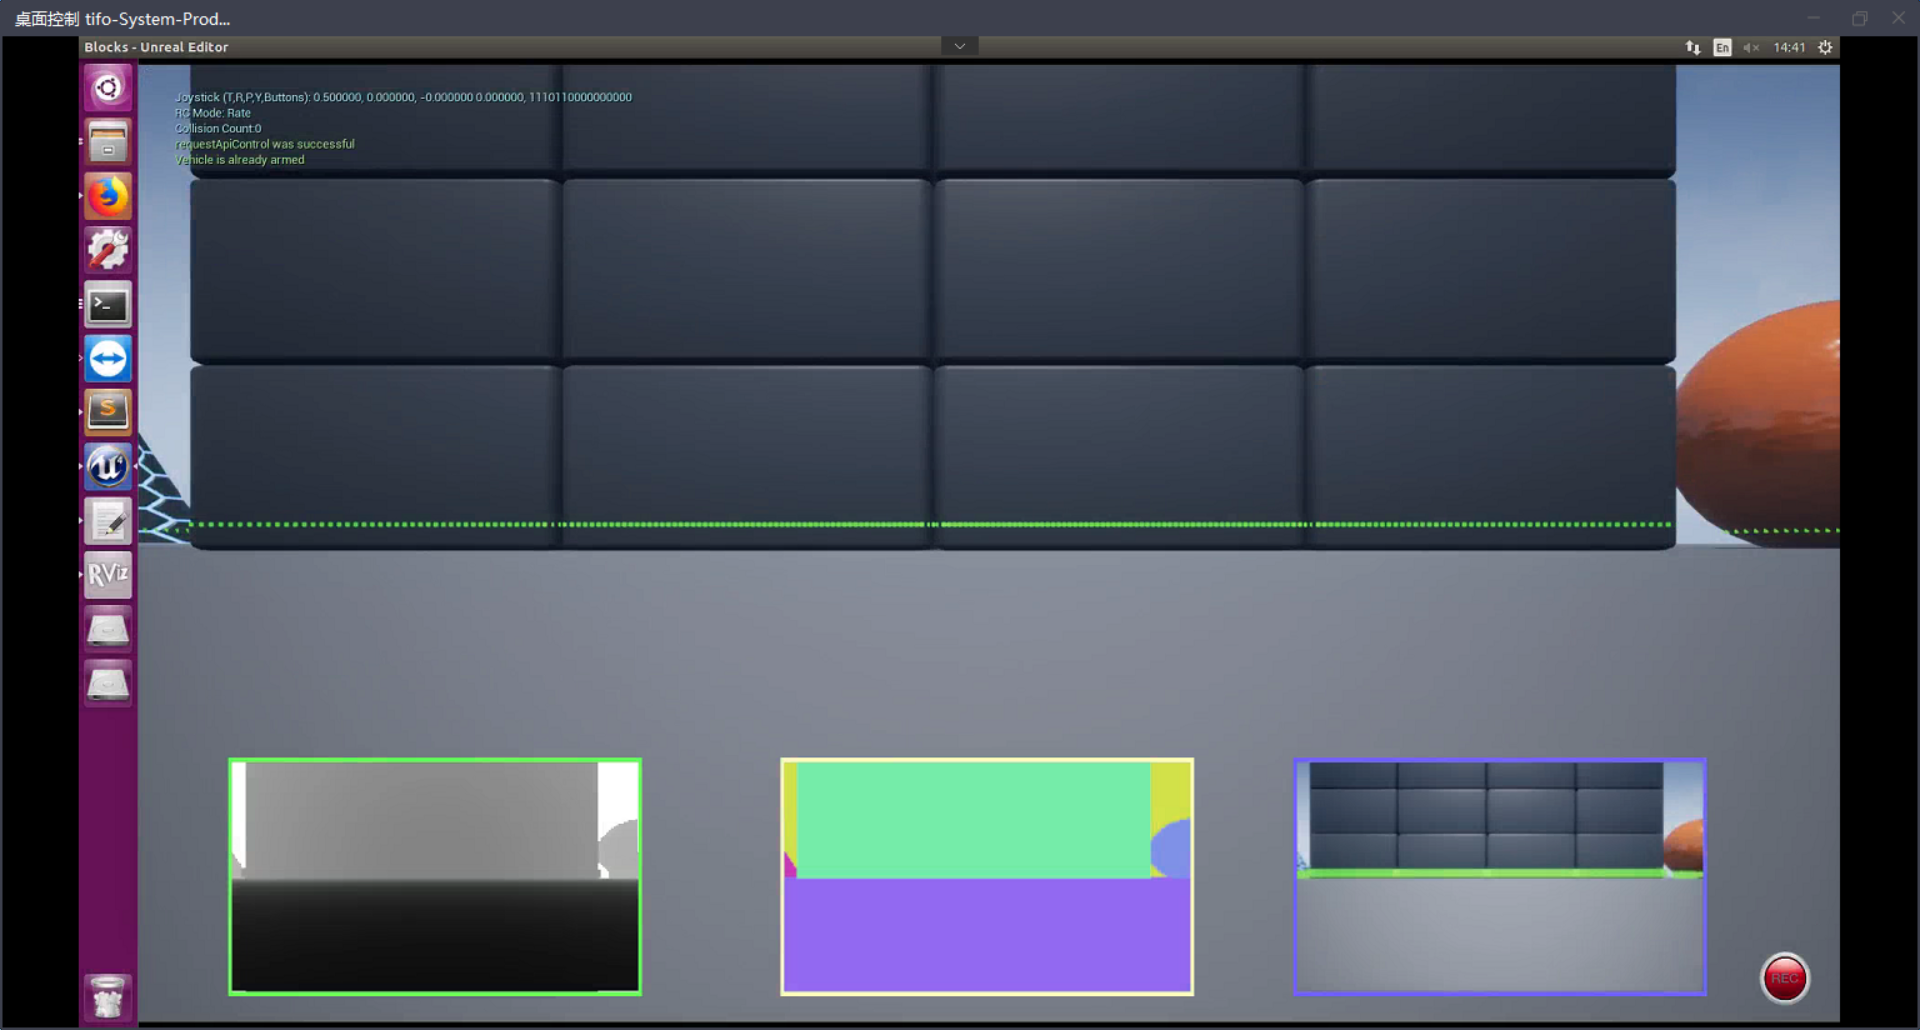
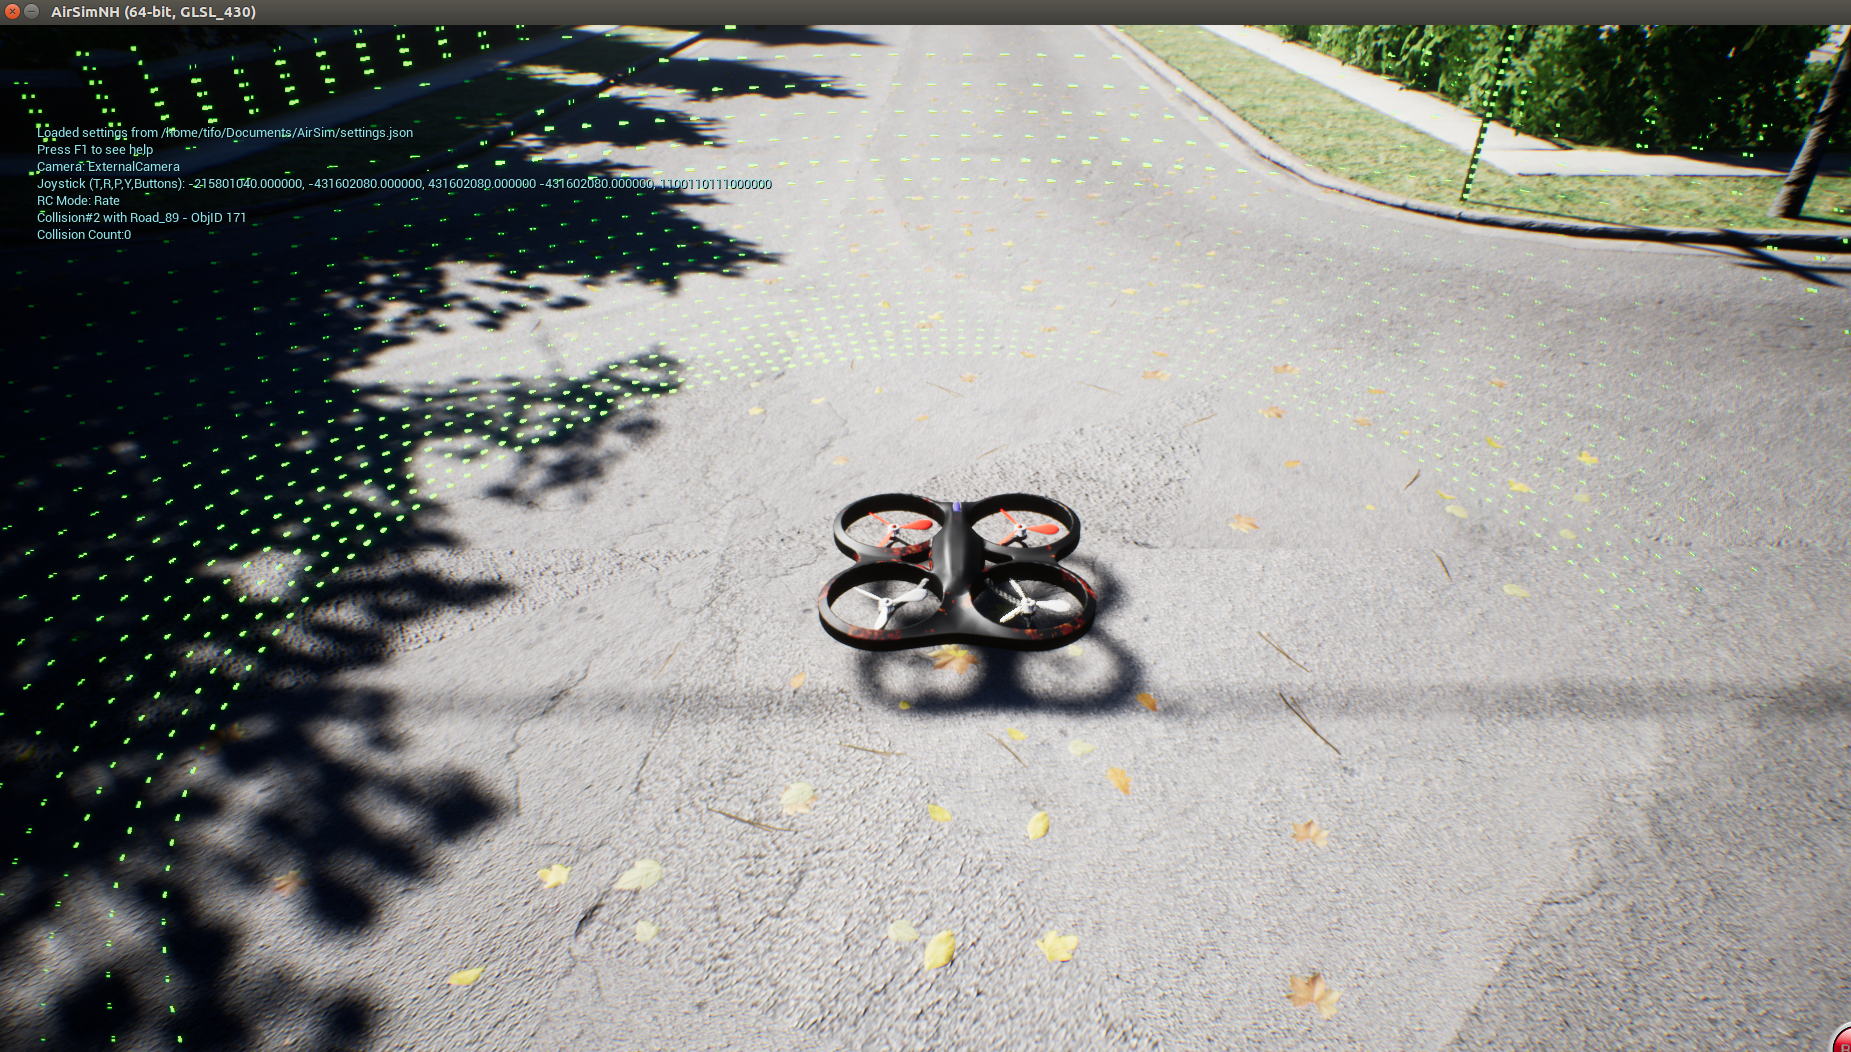
测试环境
2.2 Python代码编写(LaserScan)
LaserScan是一个二维结构,即垂直角度为0
LaserScan消息定义:官方定义
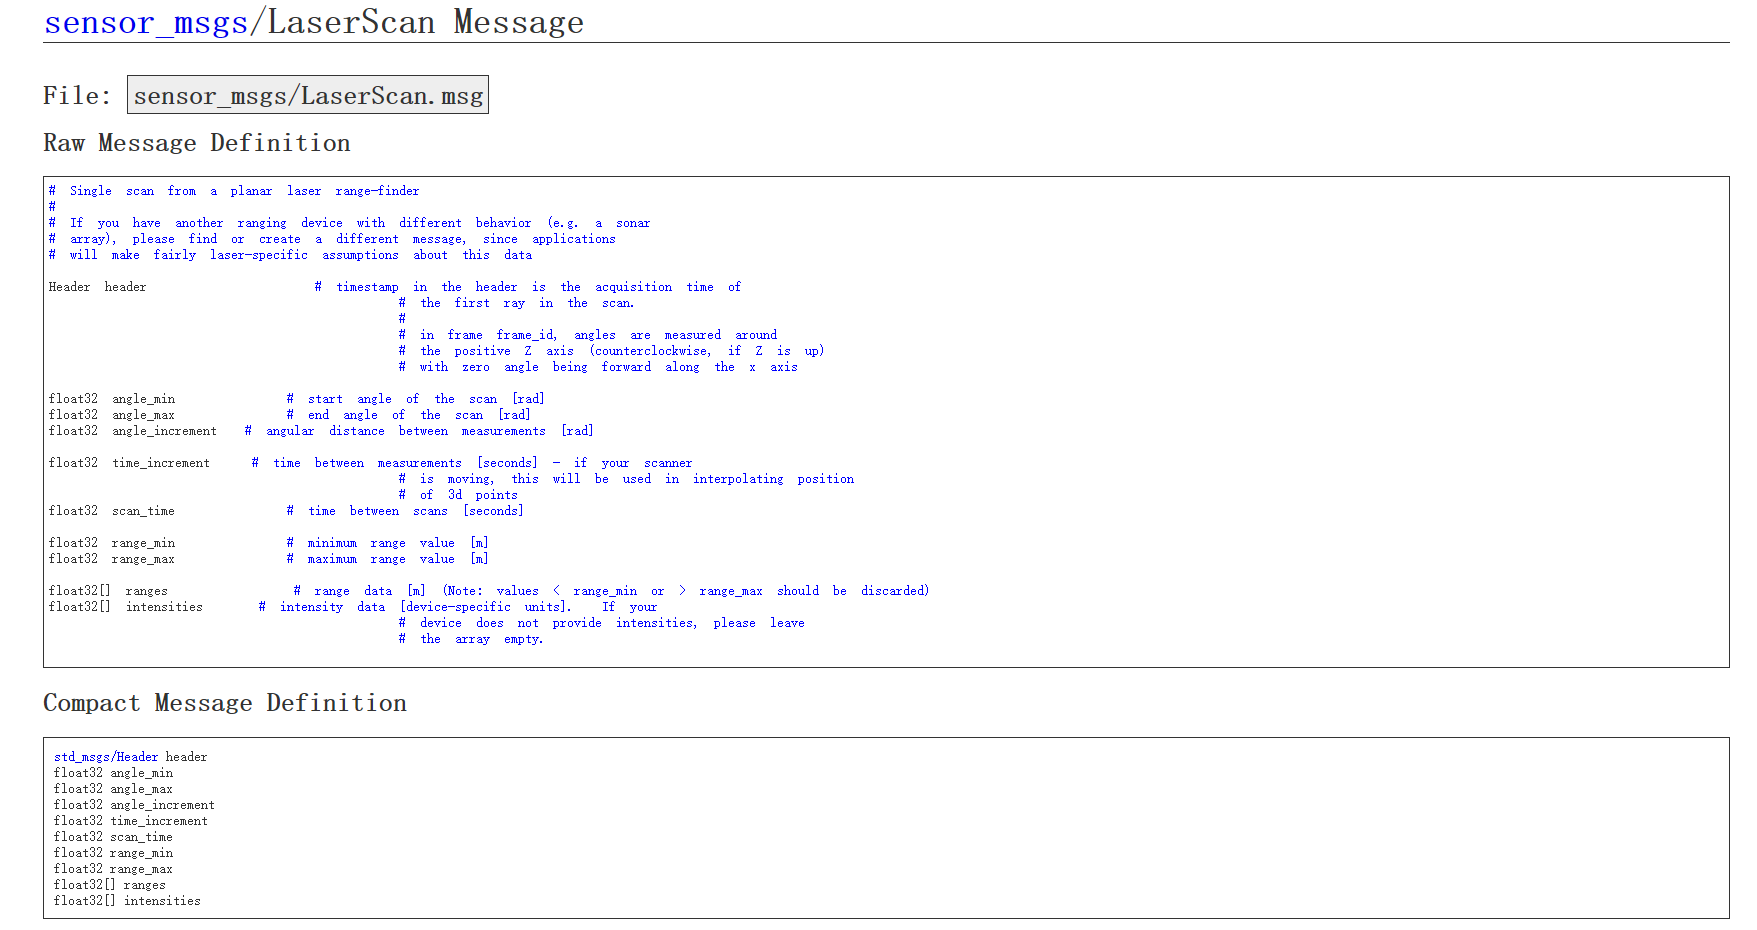
1 | Header head: |
ros发布LaserScan消息(Python)
1 | #!/usr/bin/env python |
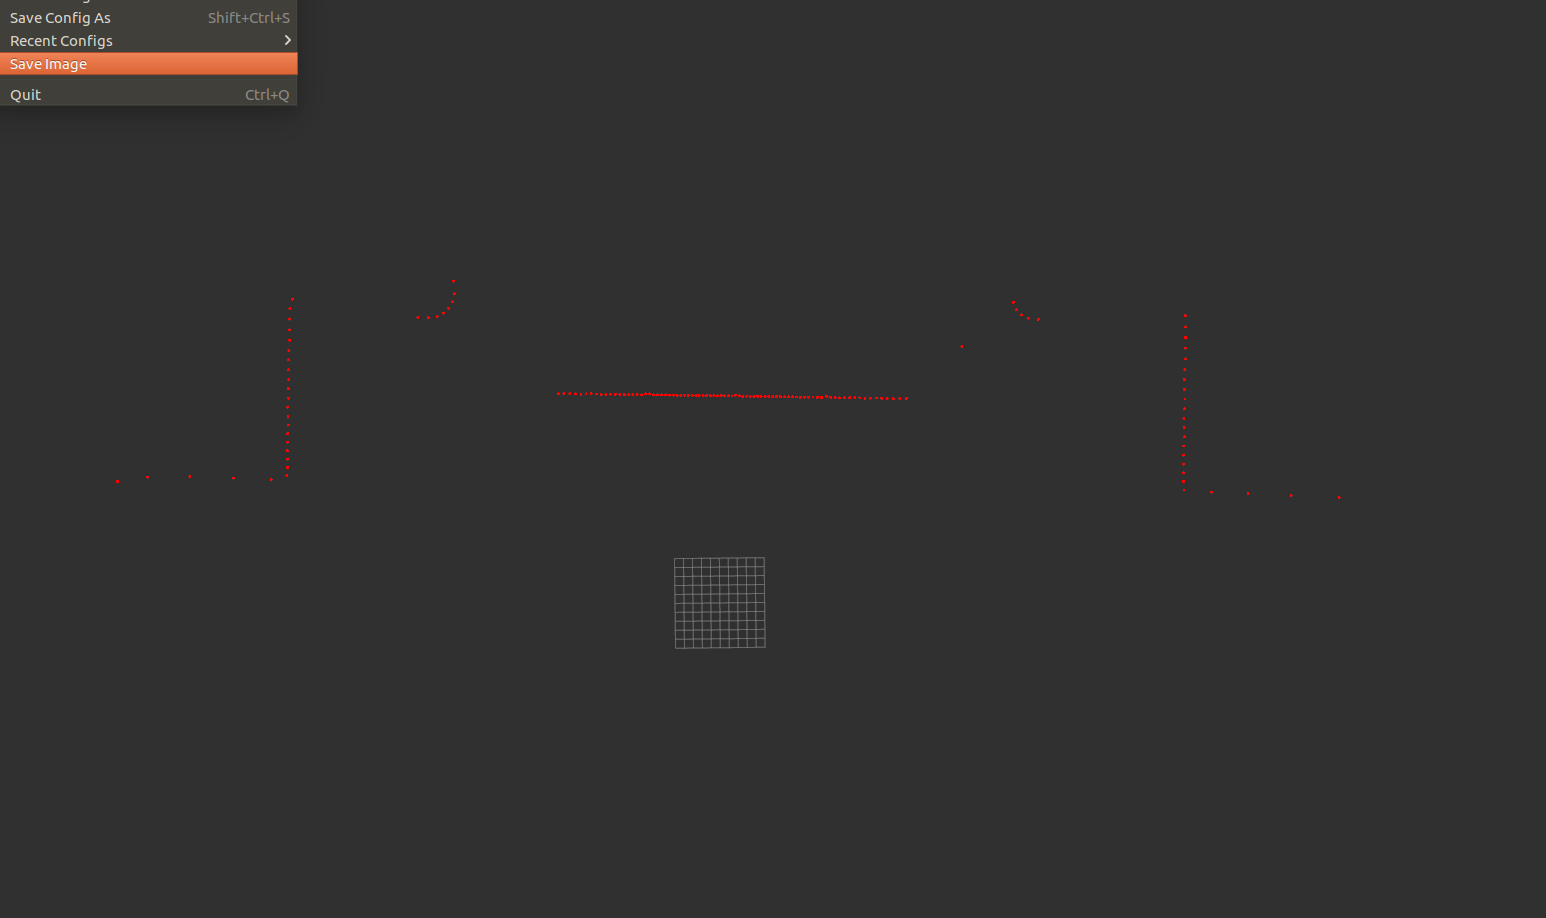
rviz显示LaserScan数据
要注意,在rviz界面中,将Style的类型设置为Points,否则可能会看不到点,具体的见PointCloud中的图片
2.3 Python代码编写(PointCloud)
1 | #!/usr/bin/env python |
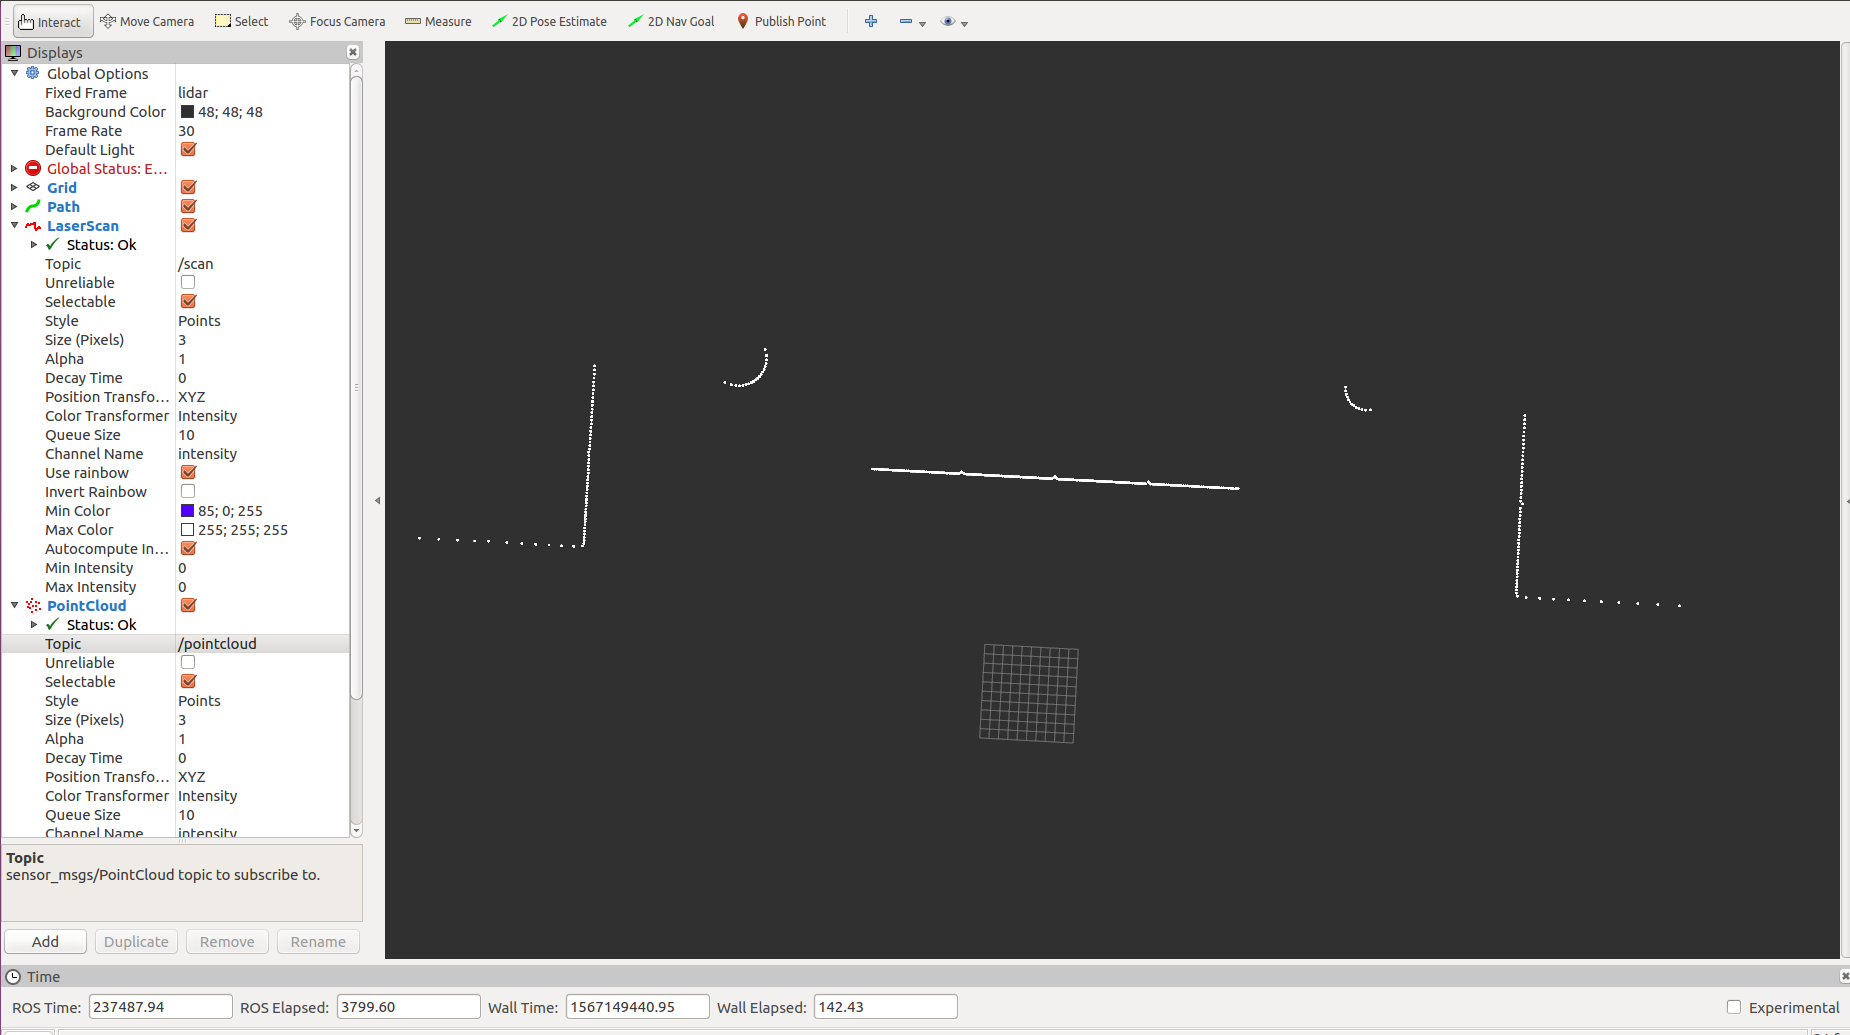
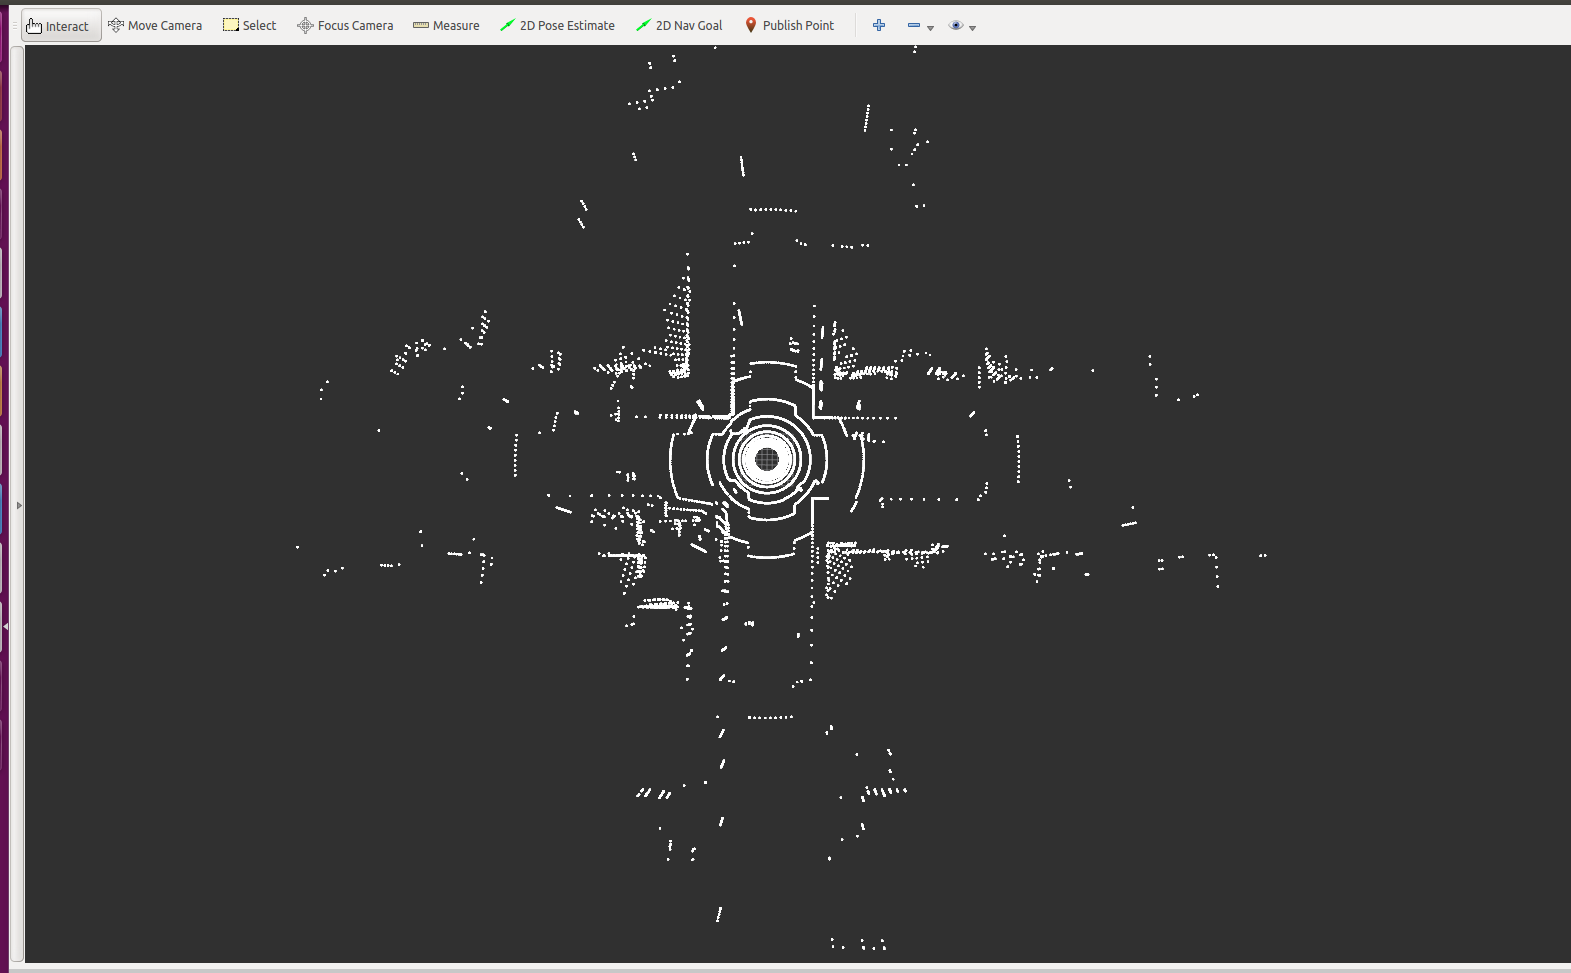
rviz显示PointCloud数据
其中的Style要设置为Points
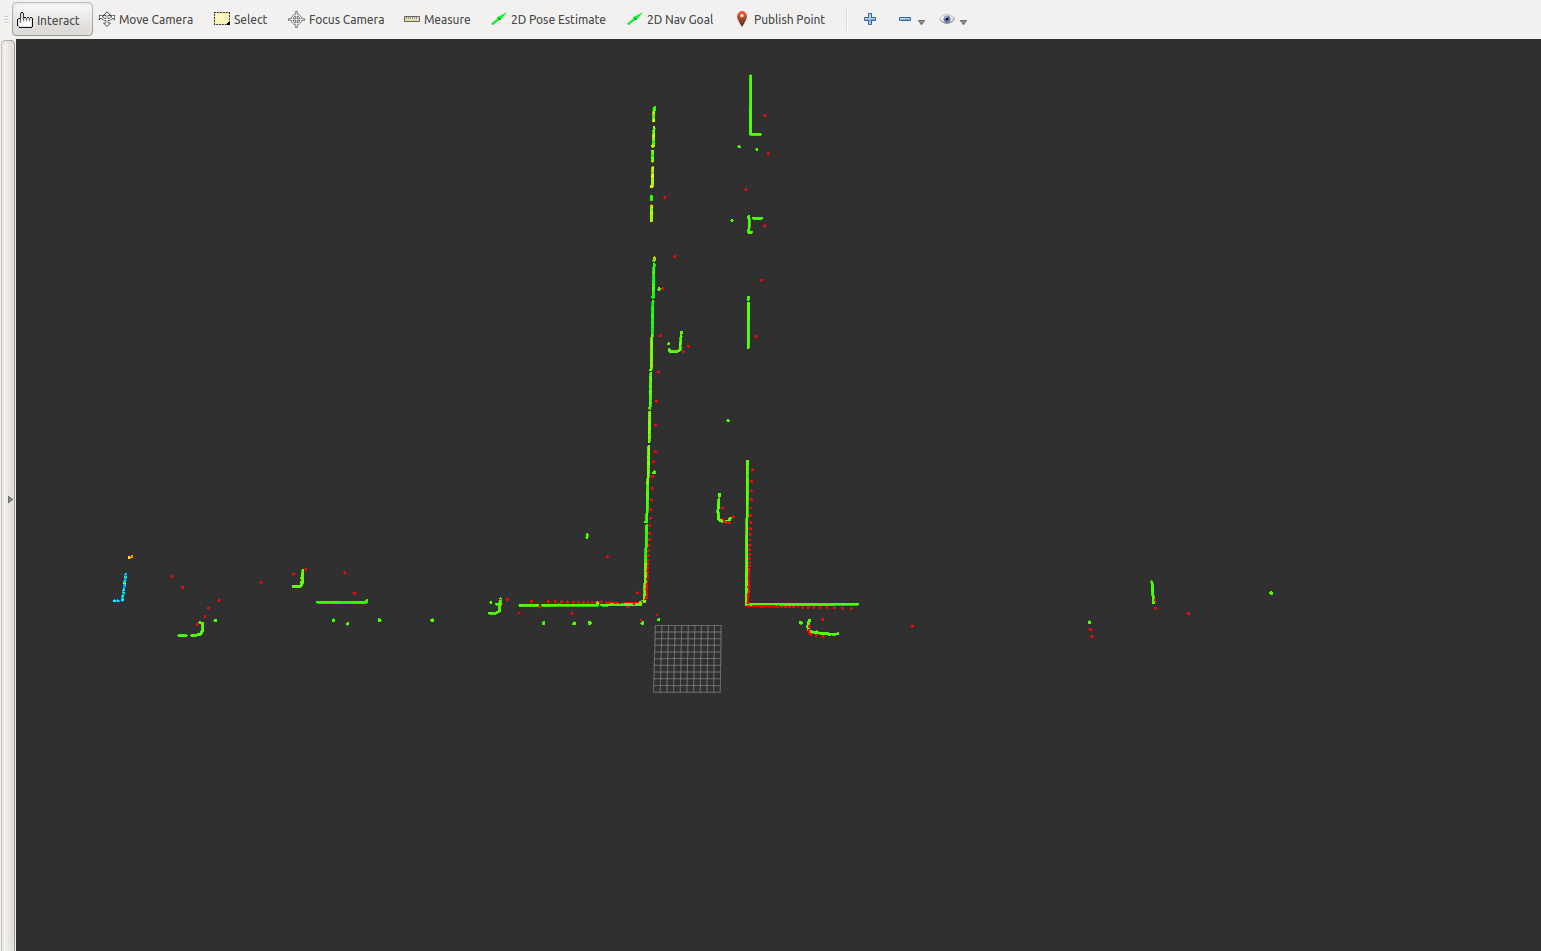
2.4 rviz同时显示LaserScan和PointCloud数据
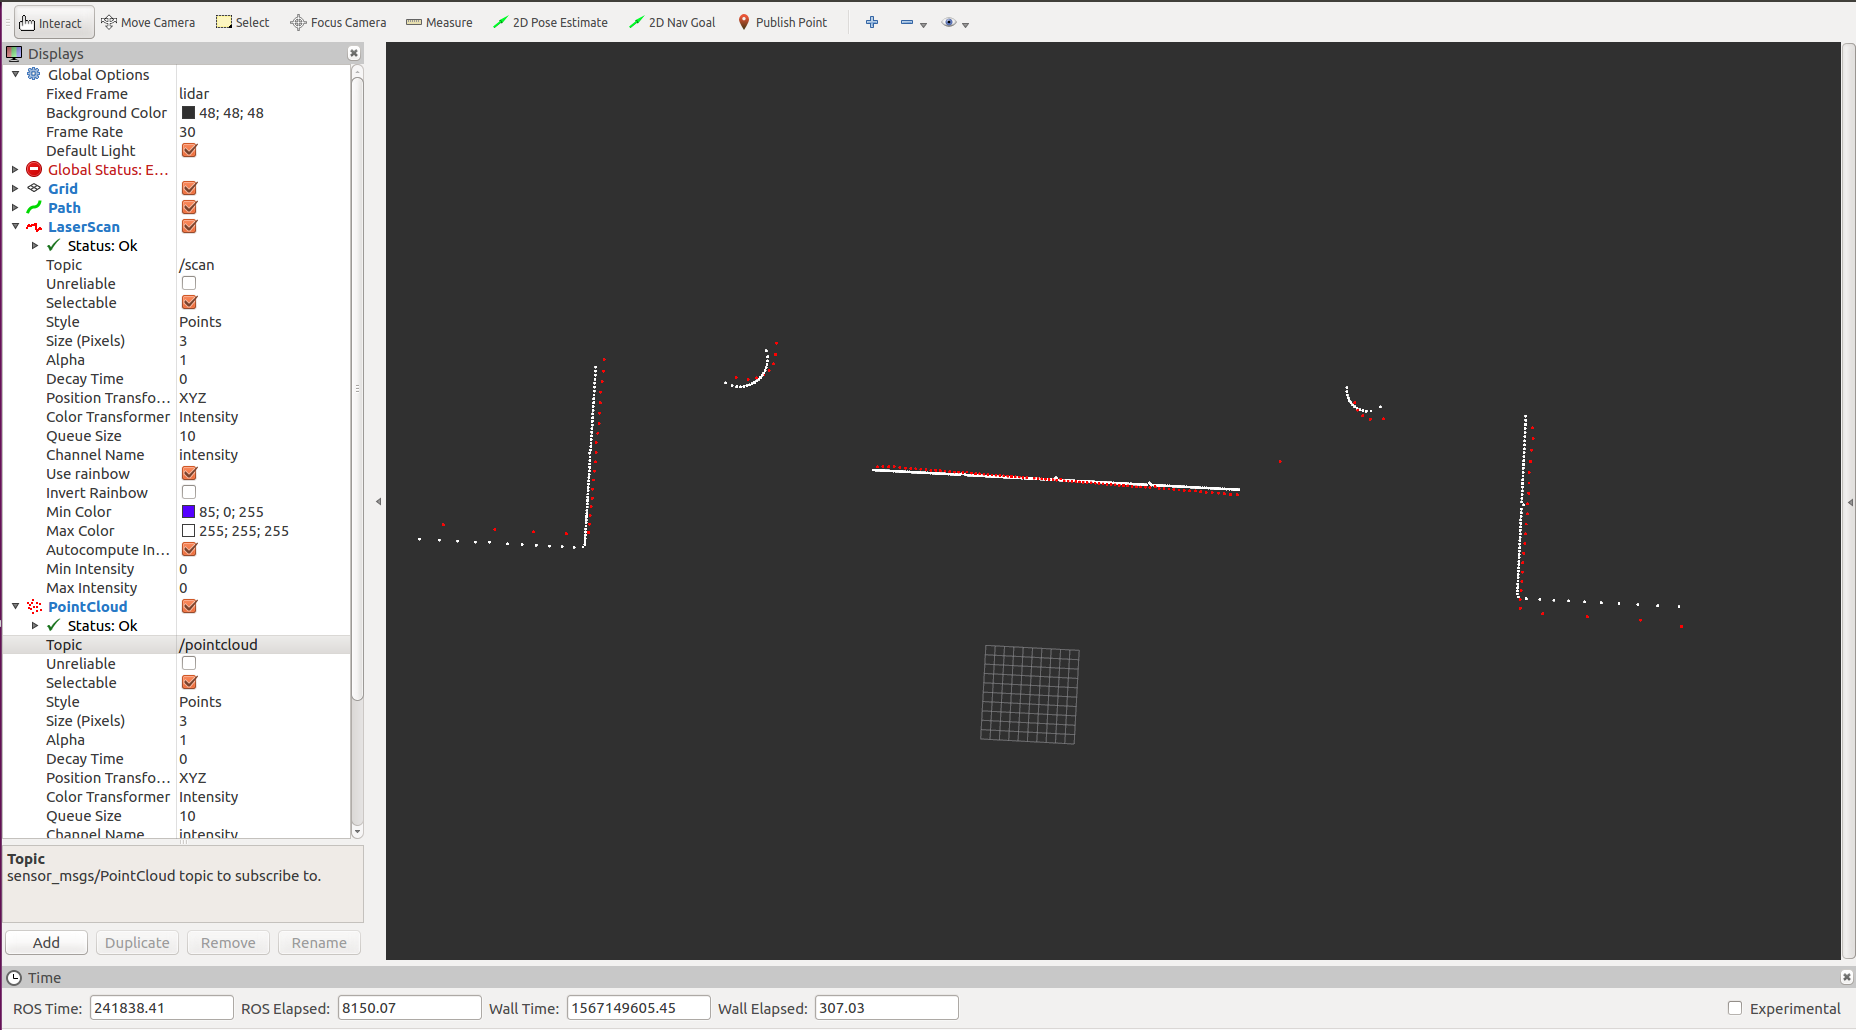
上图中,红色的为LaserScan数据,白色的为PointCloud数据,能够从图中看出,红色的和白色的点还是很接近的。为什么不一致呢?因为LaserScan是封装成了180个点,并且对相同的角度的距离求均值得出来的,而PointCloud直接获取的是points数据,没有做任何的修改。因此PointCloud数据更真实一点,但LaserScan目前来说也还行。
三、多线激光雷达设置
3.1 settings.json设置
1 | { |
测试环境(16线的显示)

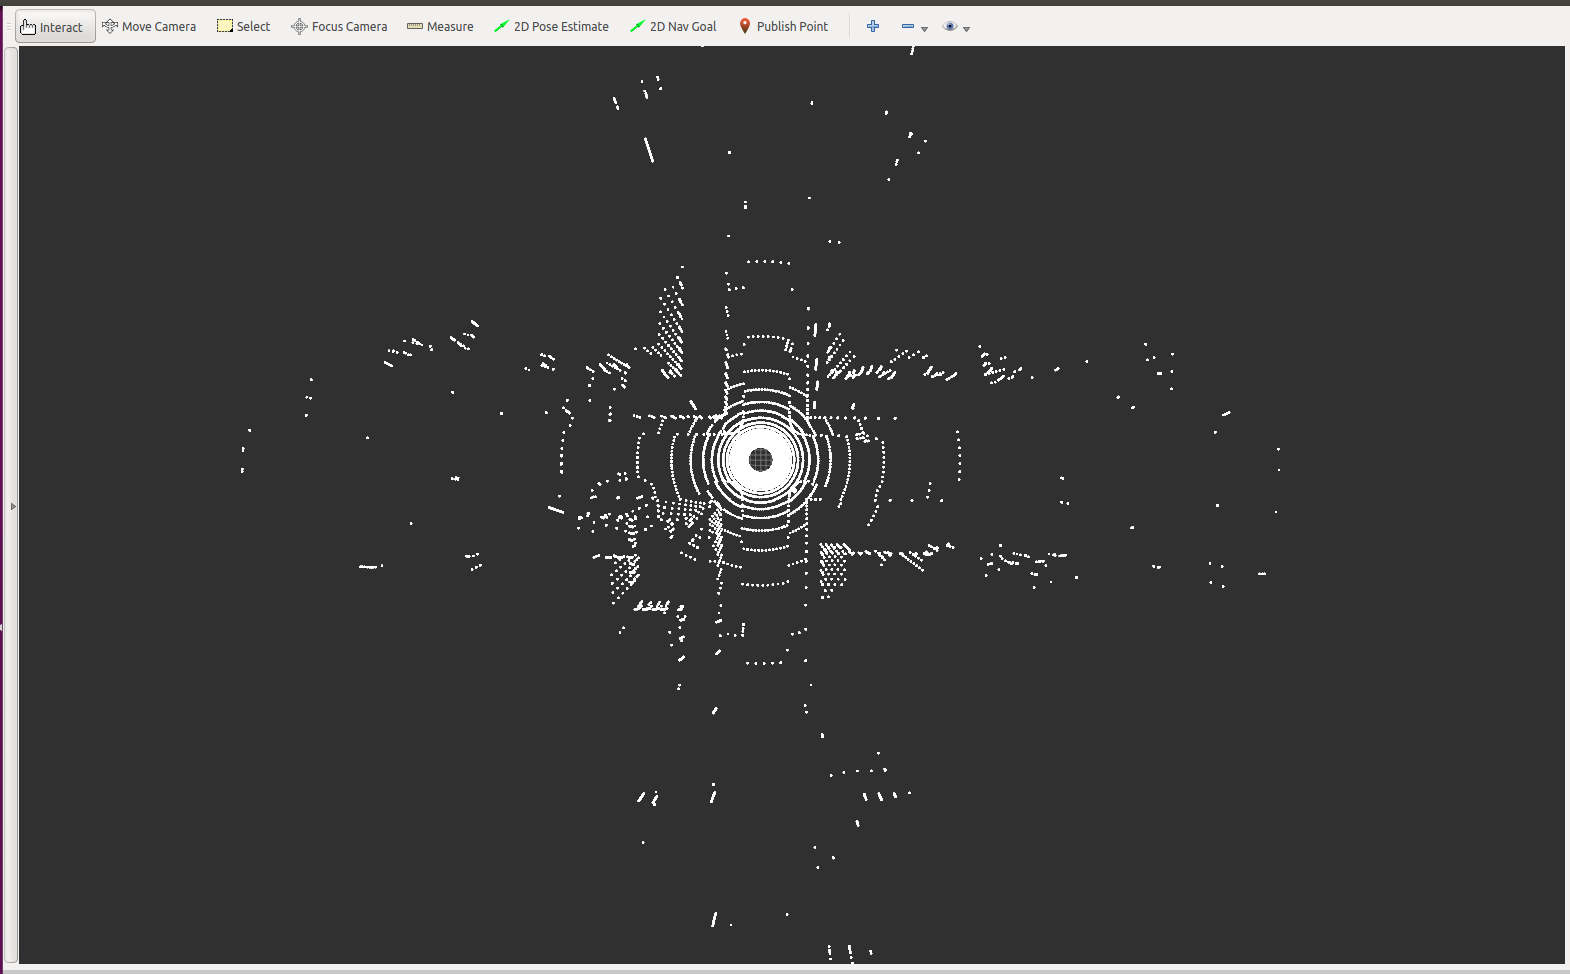
3.2 PointCloud显示
代码和2.3节的代码一样
从上图中可以看出,由于channel修改为16,则会有圆圈产生,并且设置了垂直角度,因此,整个点云图看起来是3维的。
(1)若将垂直角度还是设置为0,则其点云图将会是二维显示
在json中,重新将垂直角度设为0,
1 | "VerticalFOVUpper": 0, |
则其点云图显示如下,则将会二维显示
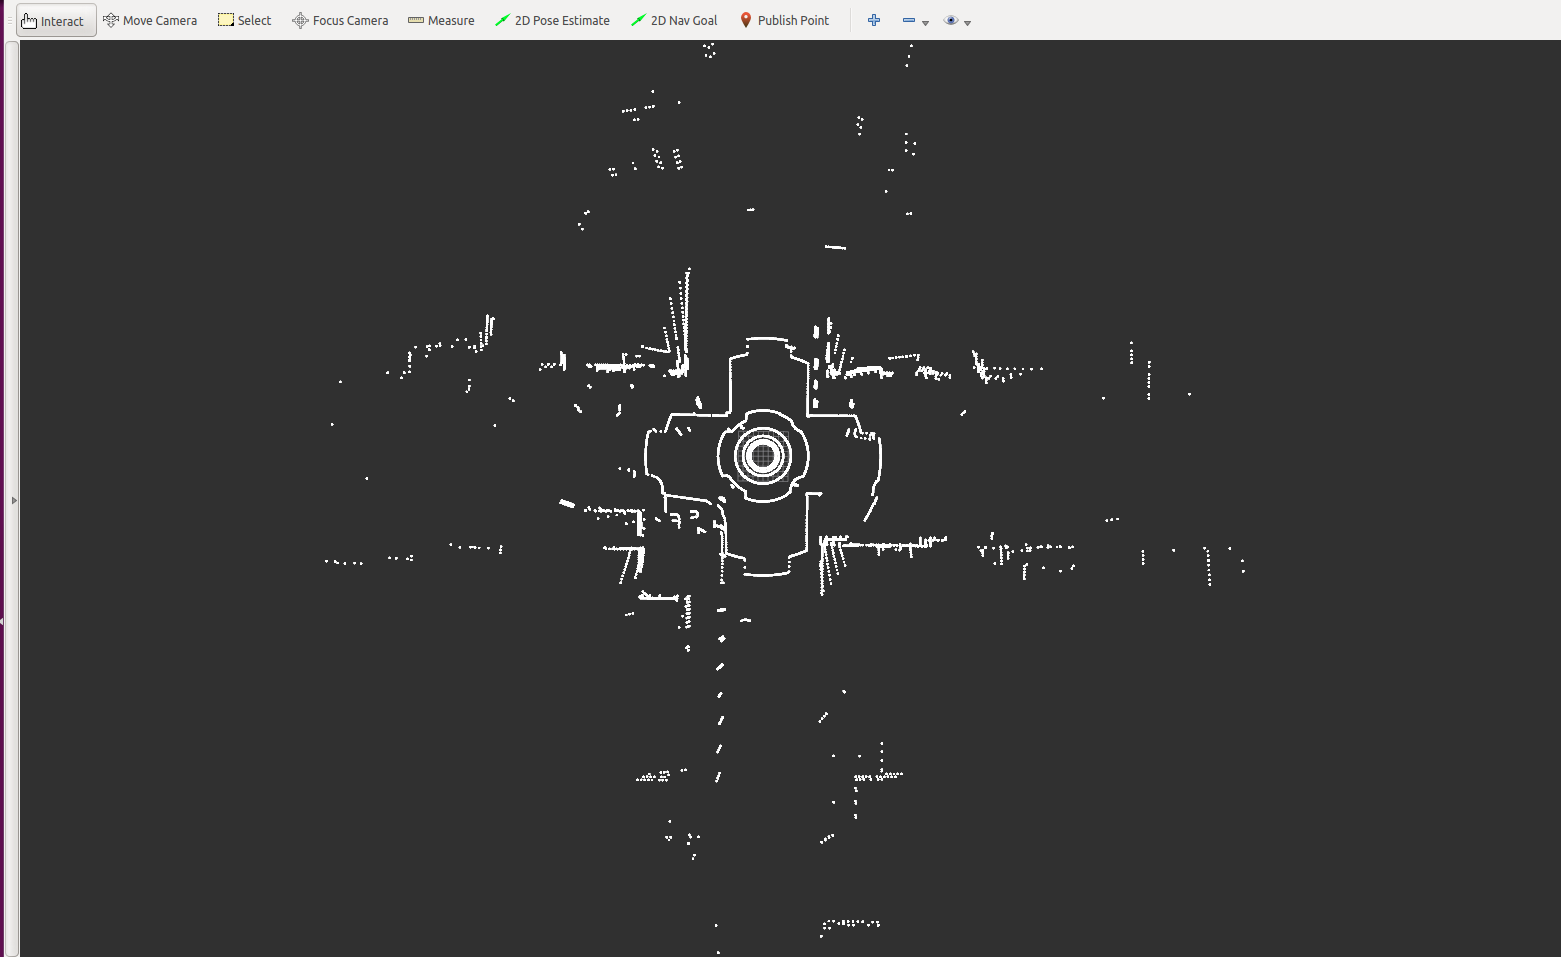
(2)若垂直角度还是40度,增大channel,如增大为32或64时,显示效果如下:
设置为32线时,其环境中可视化的激光圈数明显增加
其rviz图为:
设置为64线时,环境中激光可视化
其rviz图:
从这个中可以看出,随着channel的增加,其环境中可视化的激光圈数明显增加,并且rviz里面的探测距离明显变得更远。
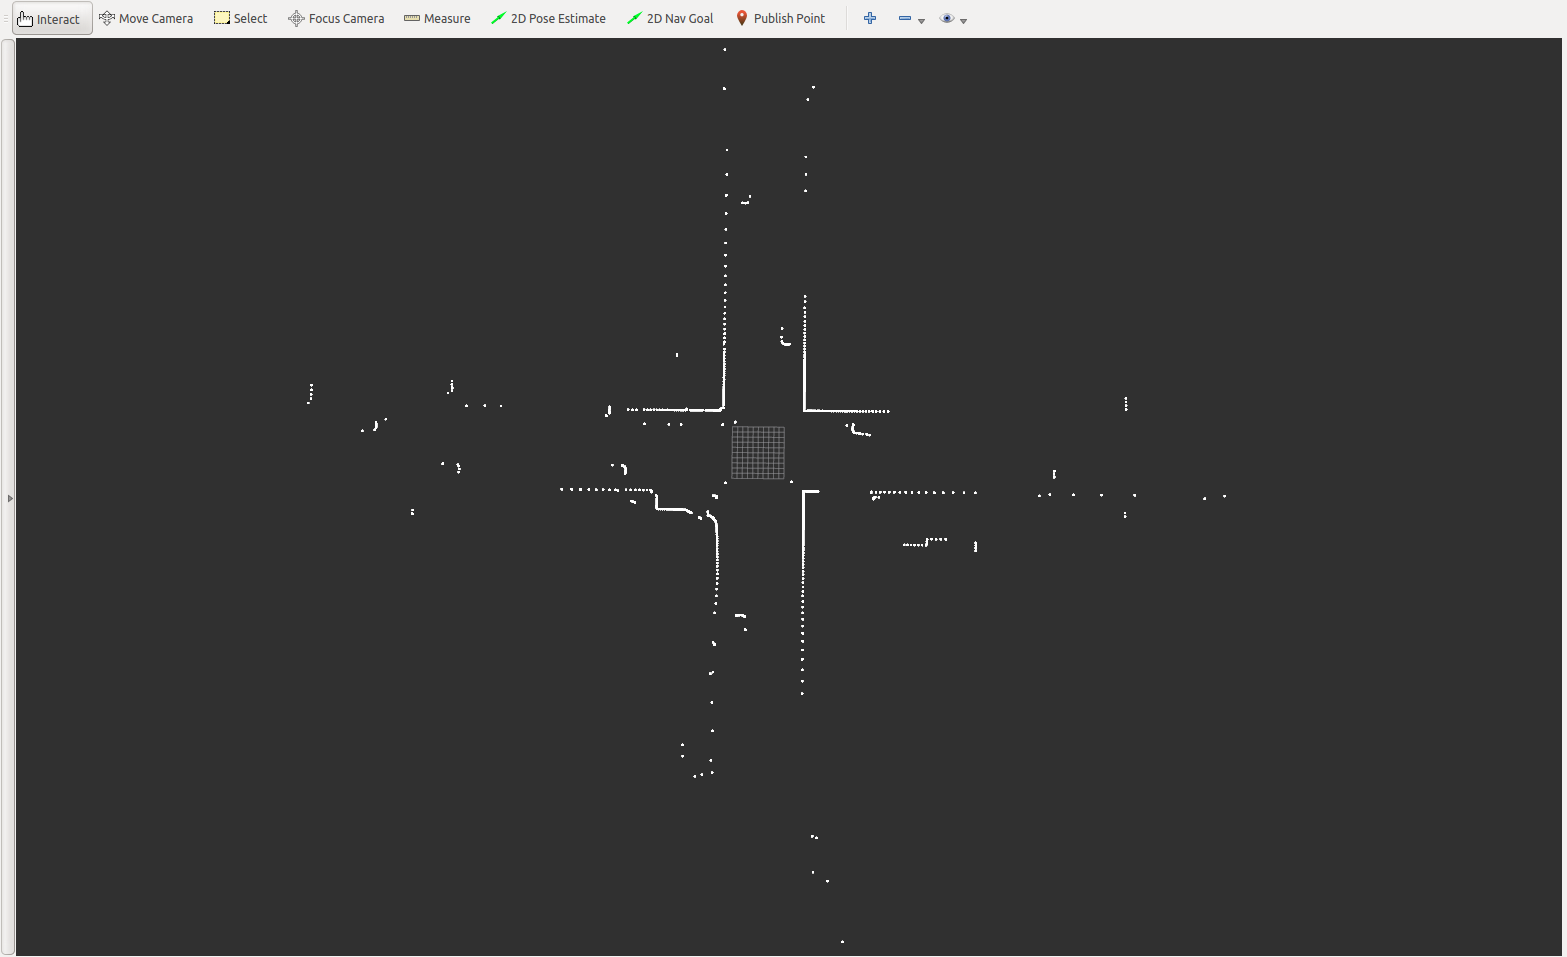
(3)垂直角度40度,64channel,并设置50w个点
尝试过设置100w个点,但是在启动sh文件时,UE4左上角会提示Lidar capping number of points to scan信息,感觉还是有些问题的,但是100w个点,仍然能显示。因此后面修改为50w个点,没有该信息提示
rviz显示图为:
和上一张图比较,增加更多的点,其扫描出的物体能够更精确。
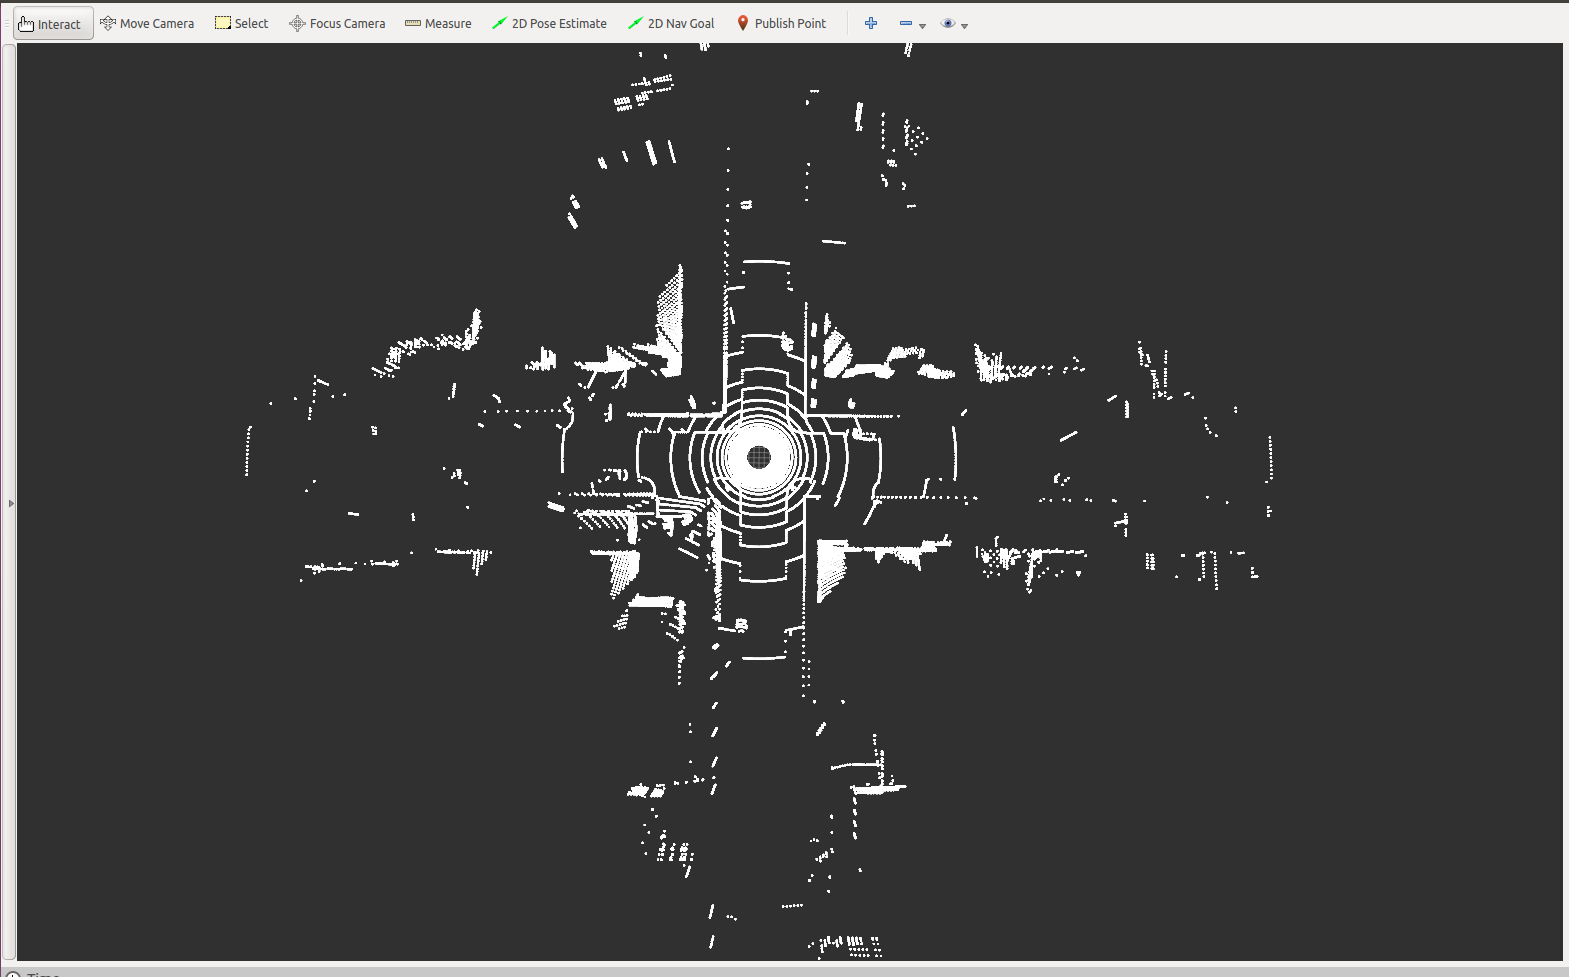
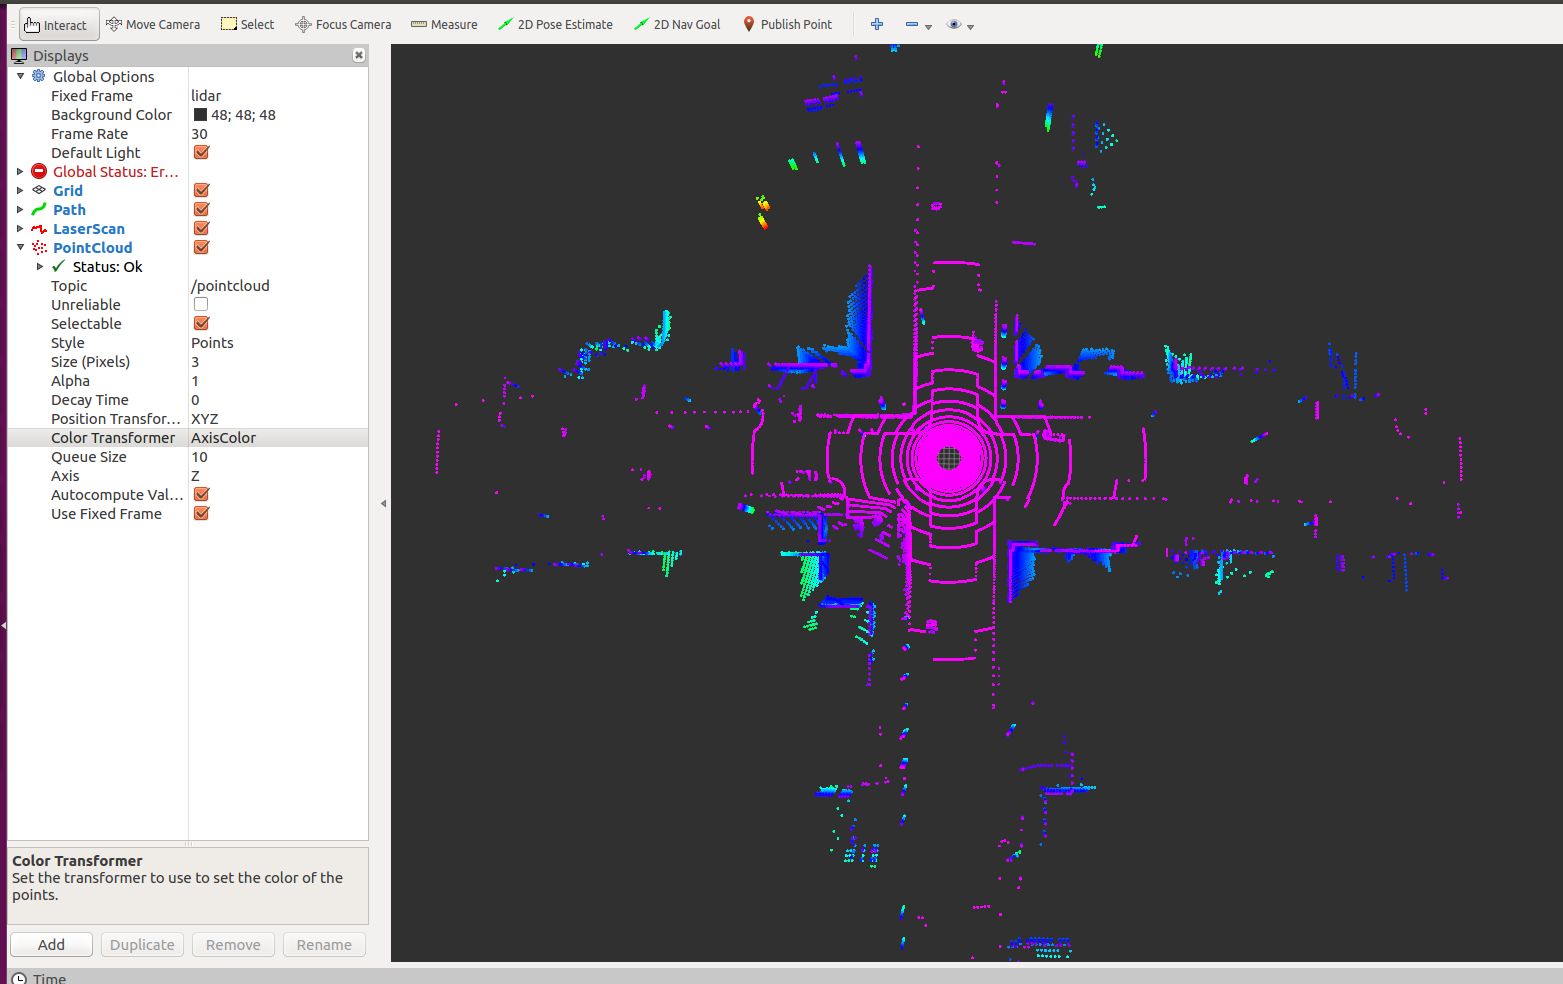
rviz显示PointCloud并上色
在Color Transformer一栏,设置为AxisColor,则其效果见下图
四、比较
4.1 单线,50w点,无垂直角度,水平角度范围180
PointCloud显示
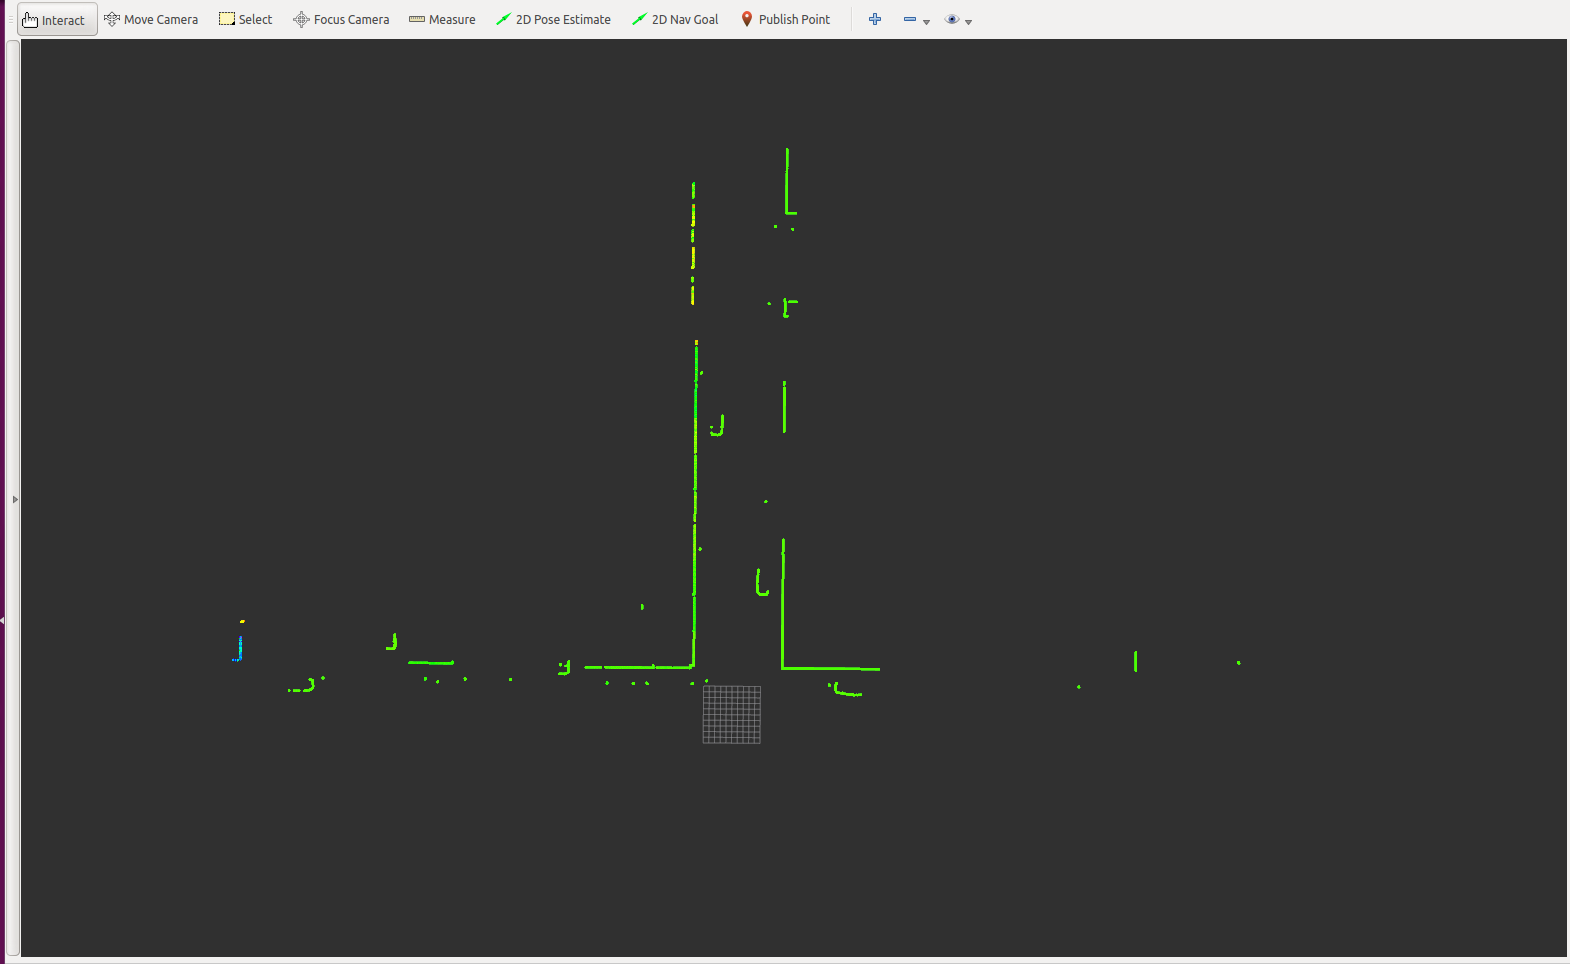
LaserScan显示
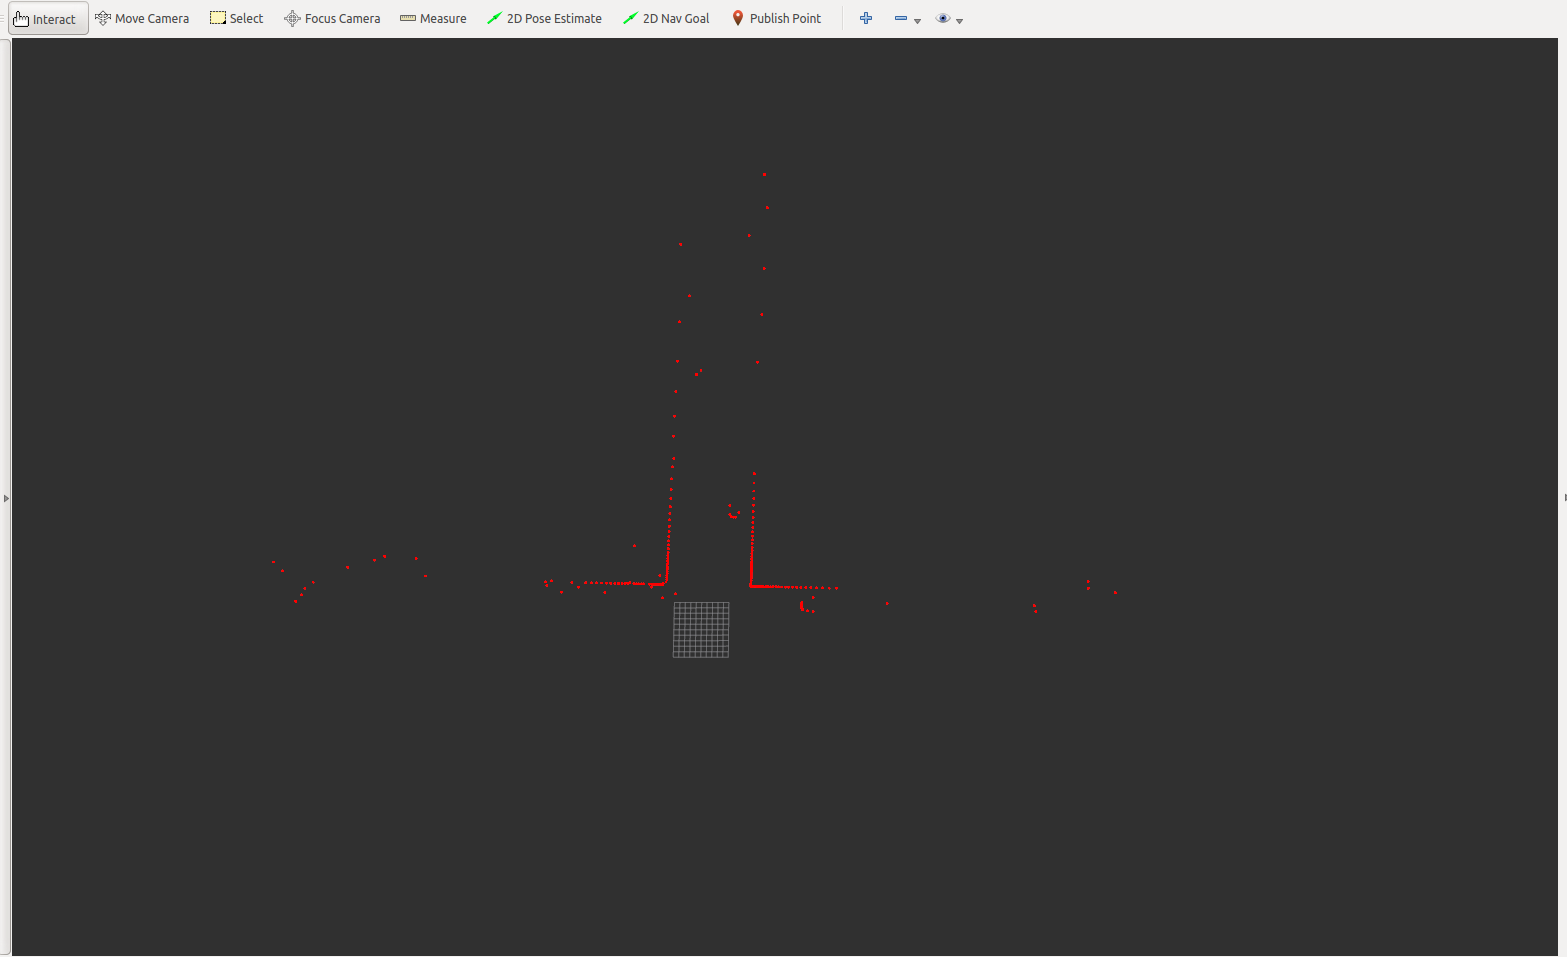
LaserScan和PointCloud同时显示
4.2 单线,50w点,垂直角度40度,水平角度范围180
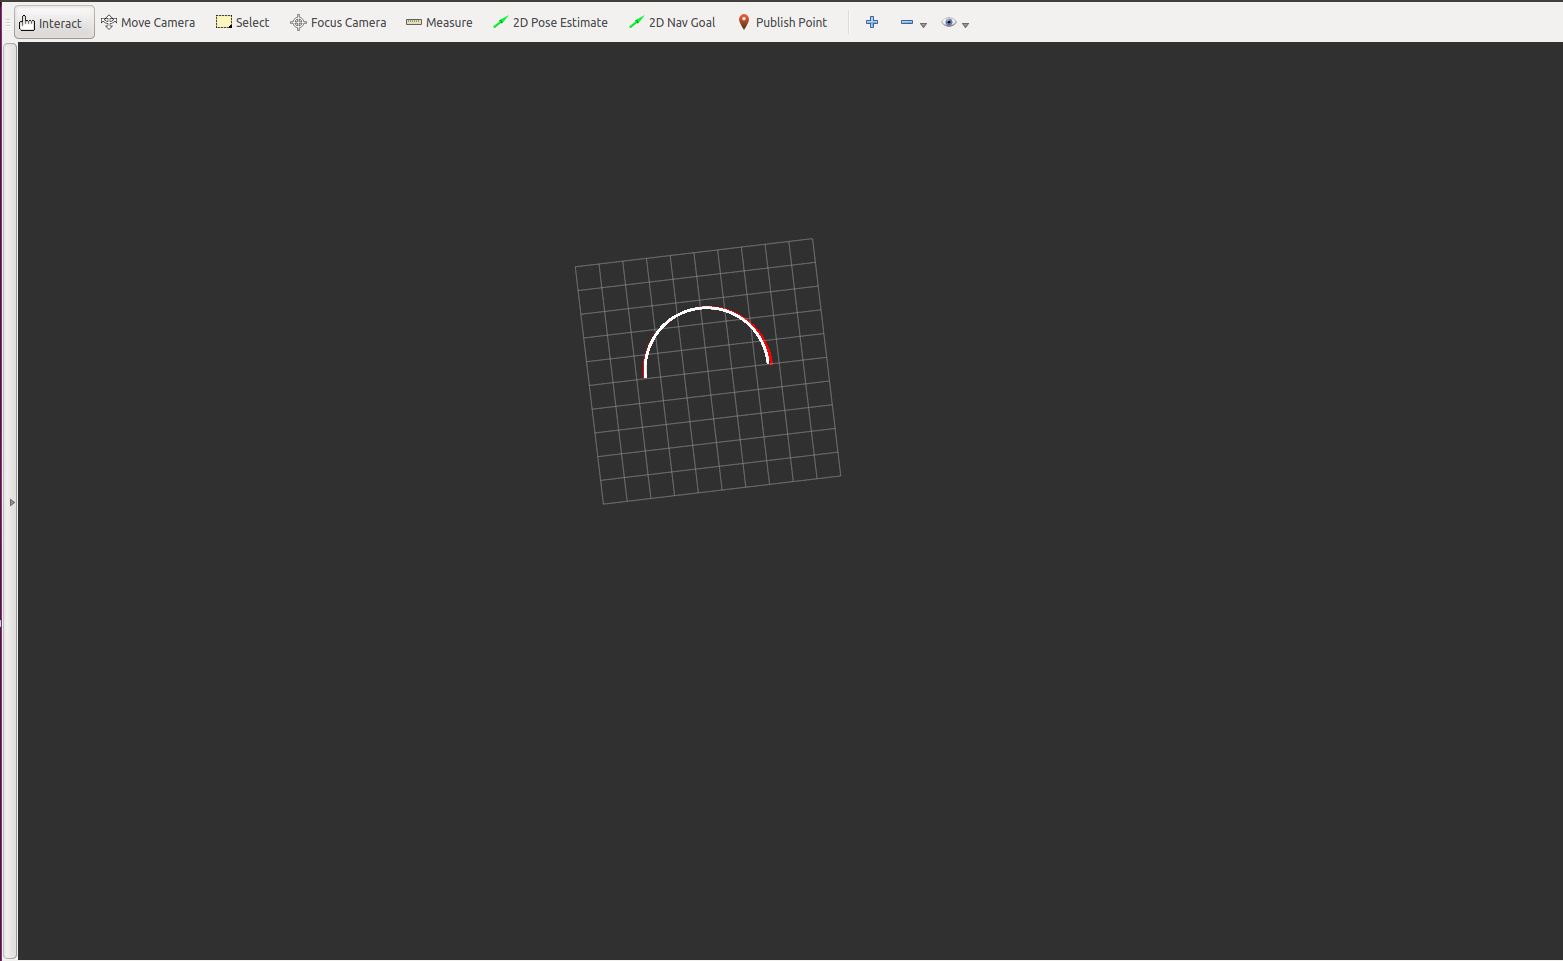
红色的LaserScan数据,白色的为PointCloud数据,看起来很接近,但是添加了垂直角度后,单线的激光检测就不对了
4.3 多线(16),50w点,垂直角度40度,水平角度范围180
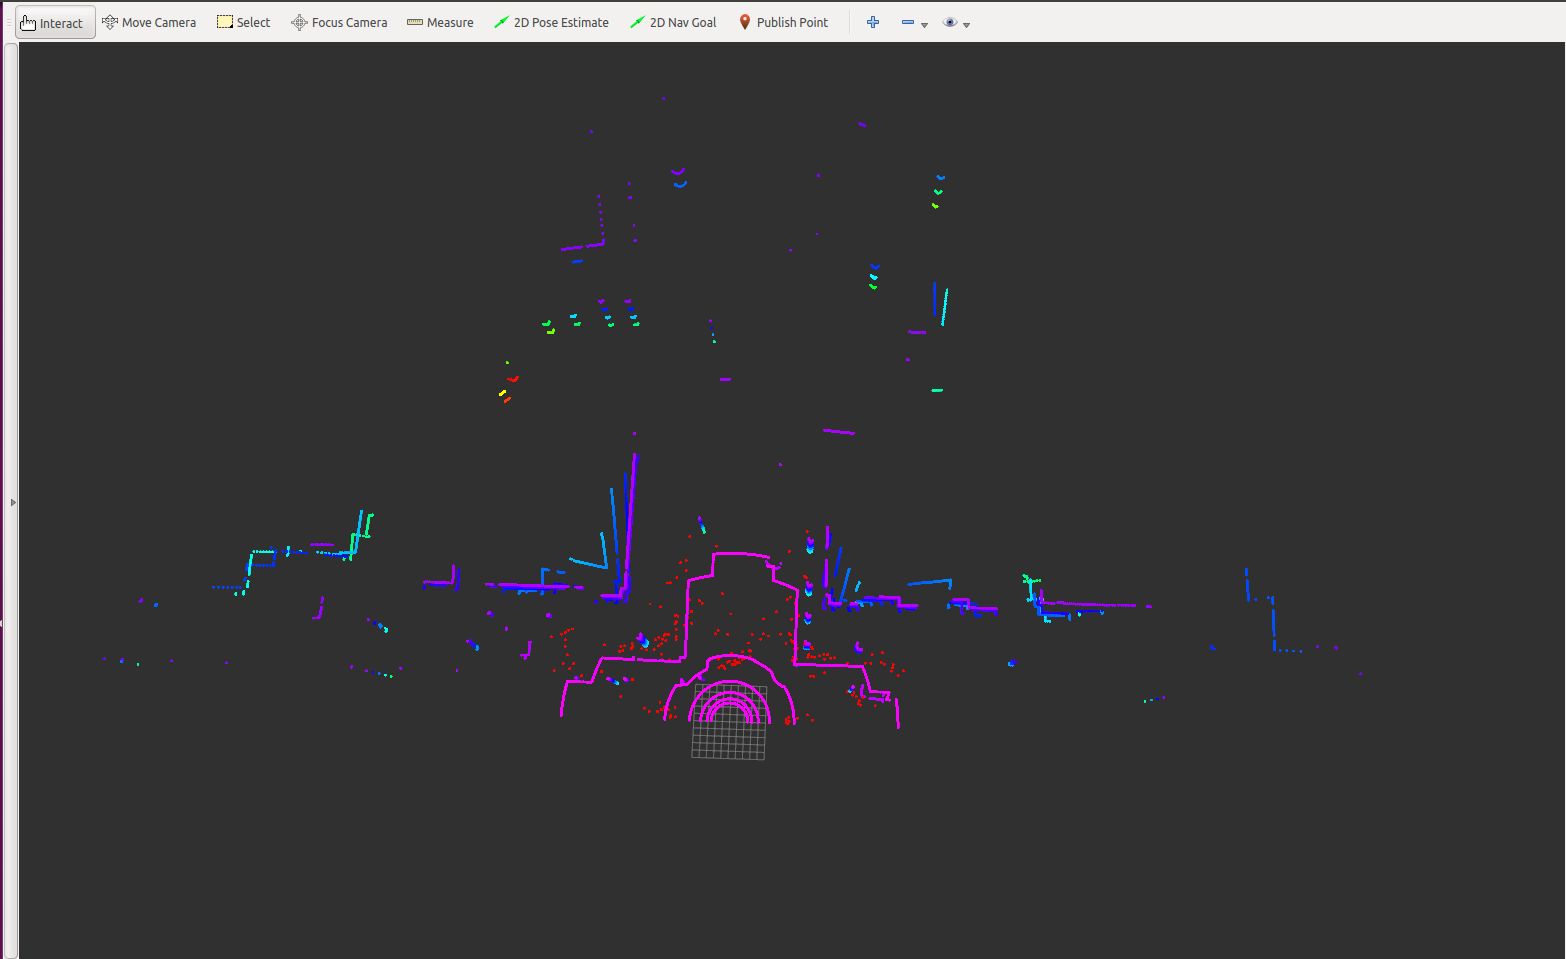
红色的为LaserScan,其他颜色的为PointCloud。
总结
通过从比较中可以看出,
(1)单线激光雷达,不适合设置垂直角度,只适合二维。就连PointCloud在单线垂直角度下,都显示不对
(2)多线激光雷达,一般设置垂直角度,显示三维点云数据
我目前设置的LaserScan,是对数据进行了处理,但是目前只考虑了180度的范围,没有考虑360度,因为360度中角度会发生相应的变化,后面会在继续进行处理~
参考链接
已经测试过的LaserScan转PointCloud2
1 | #!/usr/bin/env python |